
Barcode scanner
Scan a barcode or type its number. Ingredients, nutrients, NOVA group and Nutri-Score come from OpenFoodFacts, then the score is worked out step by step.
Skinny Scanning video “Meet Skinny Scanning”, 28.8 seconds, no sound: screen recordings of the Android app with demo data, showing a barcode scan with its score and its working, sugar shown as sugar cubes, the meal mode that reads plates on the phone, a Myth or Fact answer with its source, and two drinks compared head to head.
Screen recording from the Android app · demo data
You can't change what you don't understand.
Stop guessing what you eat. Start seeing it.
Skinny Scanning — Scan your food. Understand your choices. Take control.
SkinnyScanning.com
Scan a barcode or point your camera at a plate. Skinny Scanning shows the ingredients research links to weight gain, the study behind each one, and two healthier swaps. One score, three traffic lights, no guesswork.
Stop blaming your willpower. Start understanding your food.
Every food has a story. One barcode scan reveals the numbers.
Scan a barcode, type its number, or take a photo of your plate. Product data comes from OpenFoodFacts; meals are recognised on your iPhone.
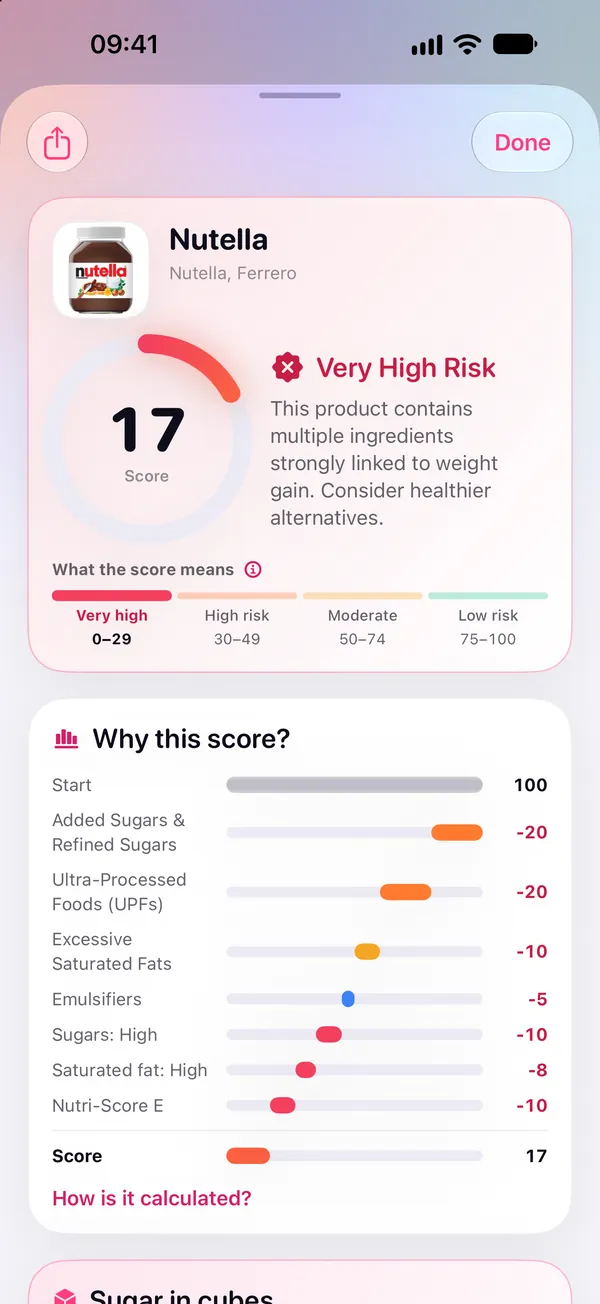
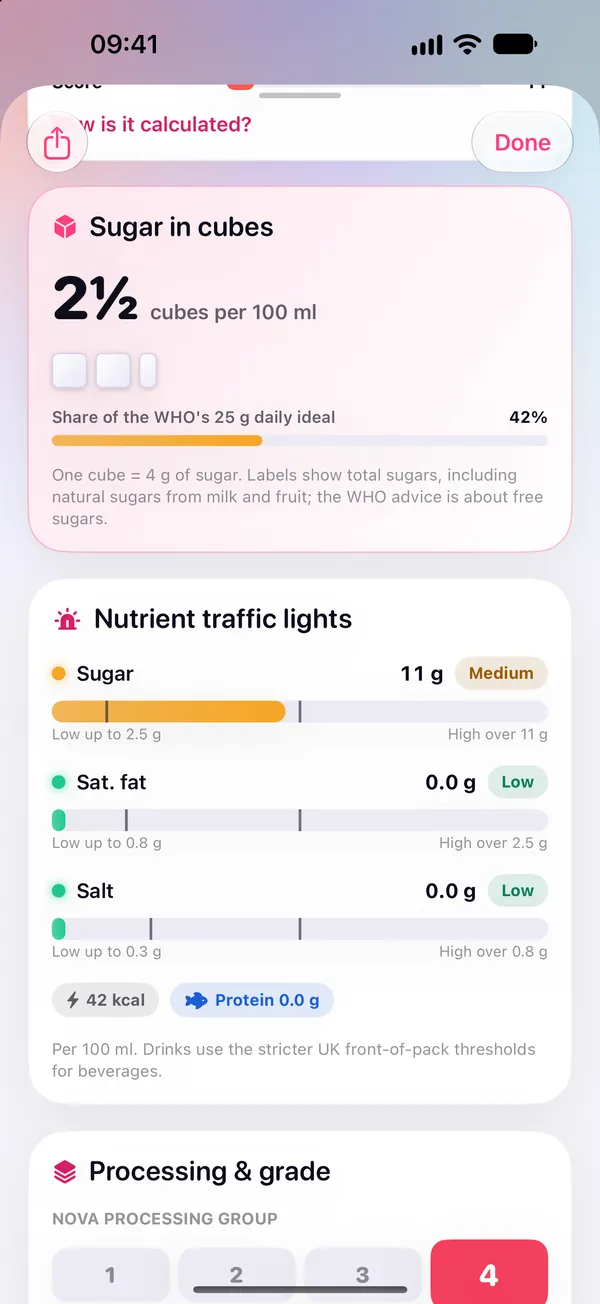
Get a Wellness Score from 0 to 100, traffic lights for sugar, saturated fat and salt, and every flagged ingredient with the research behind it.
Each flagged ingredient comes with two healthier swaps. Your seven-day average shows whether your choices are moving the right way.
Every scan starts at 100. Each ingredient the research links to weight gain removes points in proportion to how strong that evidence is. Measured sugar, saturated fat and salt and the Nutri-Score then adjust the result.
An ingredient costs more than 5 points only when there is human evidence of an effect on weight.
Example: a cereal bar with added sugar (−20), 18 g of sugar per 100 g (medium, −4) and Nutri-Score D (−5) scores 71, moderate.
Sugar, saturated fat and salt per 100 g, coloured with the UK's front-of-pack thresholds. The measured values overrule the words: a label that mentions salt but contains 0.05 g is never flagged for sodium.
| Per 100 g | Low | Medium | High |
|---|---|---|---|
| Sugar | ≤ 5 g | 5.1–22.5 g | > 22.5 g |
| Saturated fat | ≤ 1.5 g | 1.6–5 g | > 5 g |
| Salt | ≤ 0.3 g | 0.31–1.5 g | > 1.5 g |
Thresholds: UK Food Standards Agency front-of-pack guidance (2016). Drinks use lower cut-offs per 100 ml.
These are the ingredients and food groups the scanner looks for, ranked by how strongly the evidence links them to weight gain. Tap any of them in the app to read the studies and the swaps.
In adult trials, adding sugary drinks raised body weight; cohorts link each extra daily serving to more weight gain.
Partially hydrogenated oils. Linked to weight gain over eight years in the Nurses' Health Study, and to belly fat in a six-year monkey study.
In a controlled NIH trial, people ate about 500 kcal a day more on an ultra-processed diet and gained weight.
Pooled trials: cutting free sugars lowers weight slightly, adding them raises it, mainly through the extra calories.
Roughly half glucose, half fructose. Affects weight mainly when it adds extra calories.
A small, borderline link with overweight; whole grains and fibre are linked to lower body weight.
Energy-dense; flagged only when the measured level is not low.
Each extra daily serving was linked to about 0.4 kg more weight gain every four years in three large US cohorts.
Randomised trials found no effect on BMI. Cohorts link regular use to higher BMI, which may reflect who chooses diet products.
Increase how much is eaten in animal studies. No human data yet, so it costs the minimum.
Some altered gut bacteria and caused weight gain in mice. Effects on weight in people are unknown.
Mainly a blood-pressure concern; counted only above 1.5 g of salt per 100 g.
Three numbers from the studies behind the watchlist.
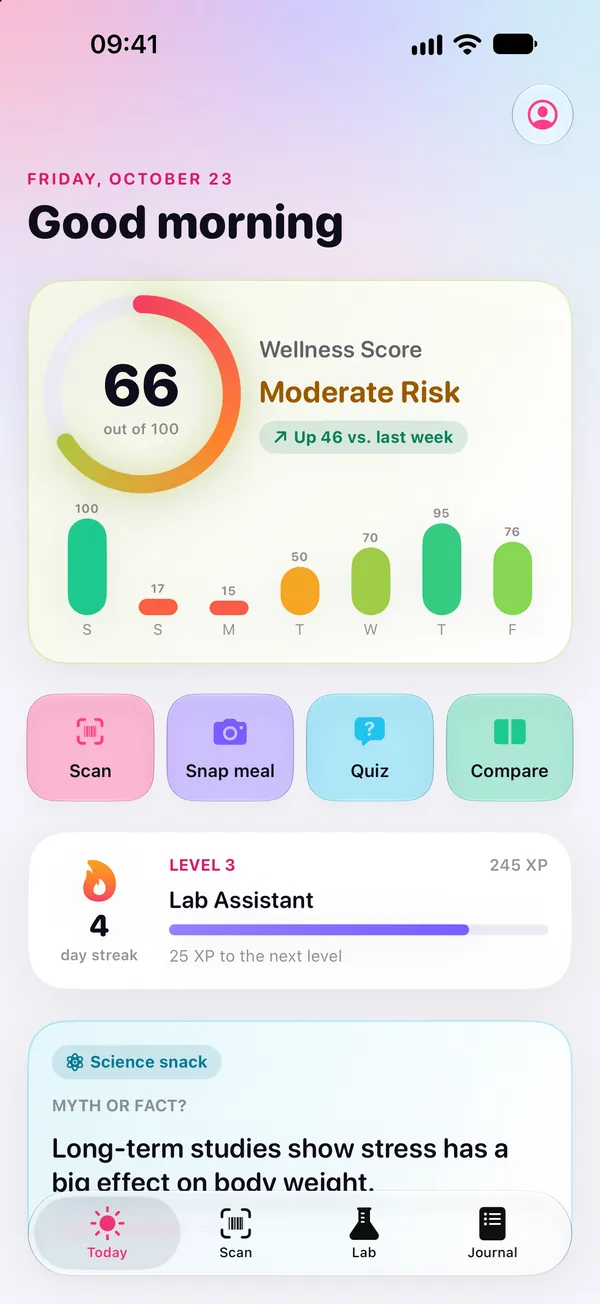
Four tabs: Today, Scan, Lab and Journal. No calorie counting, no diary to fill in.
Scan a barcode or type its number. Ingredients, nutrients, NOVA group and Nutri-Score come from OpenFoodFacts, then the score is worked out step by step.
Point it at a plate. Apple's on-device image recognition names the foods, and the meal is scored like a product. No upload, works in airplane mode.
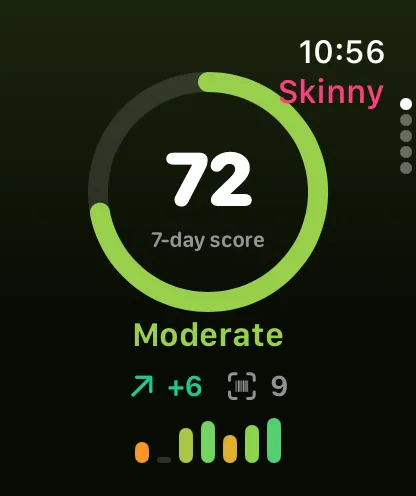
Today shows your seven-day average score, how it moved against last week, and your recent scans.
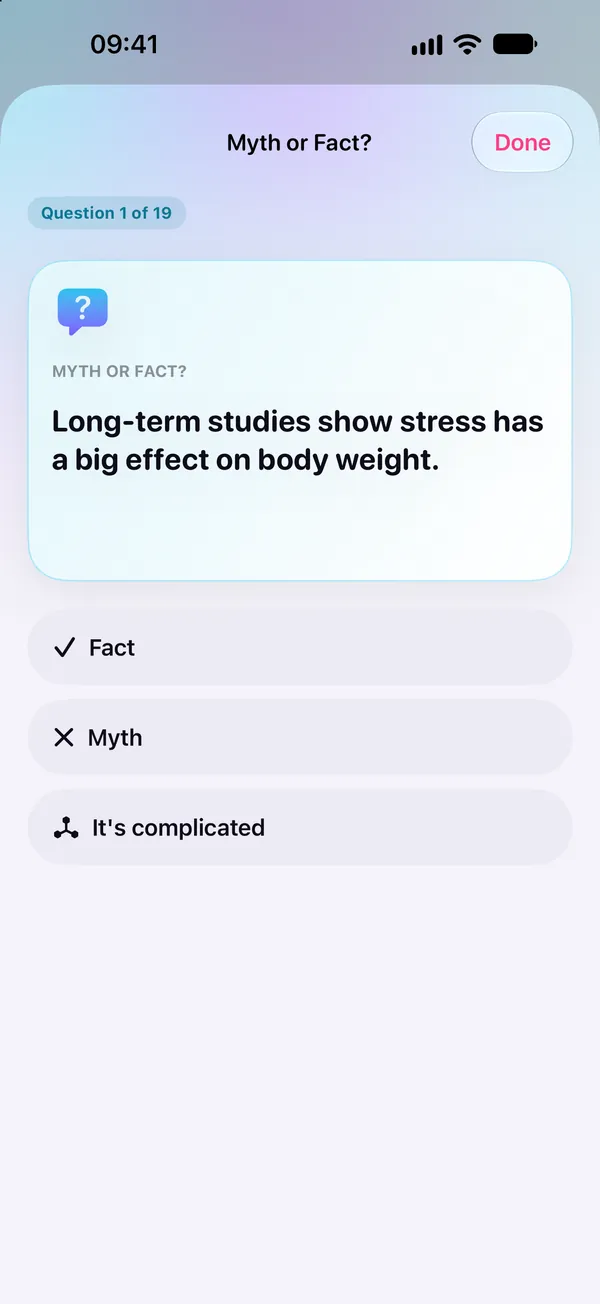
A quiz of 19 questions, each grounded in one verified study. Five explainers show how sugar, processing and labels work.
Earn XP for scanning, reading studies and answering quizzes. Fourteen badges reward curiosity; none rewards eating less or a lower weight.
Every scan is kept on your device. Put two products side by side to see which one is the better choice, and why.
No mockups: screenshots of the real app, running on demo data.
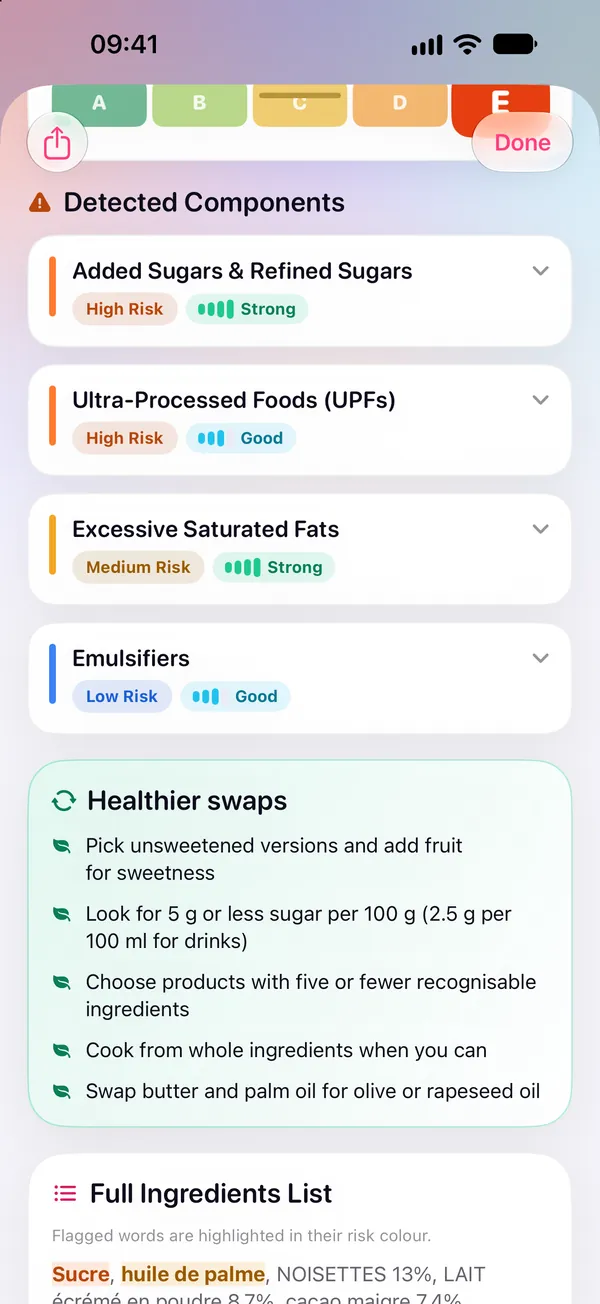
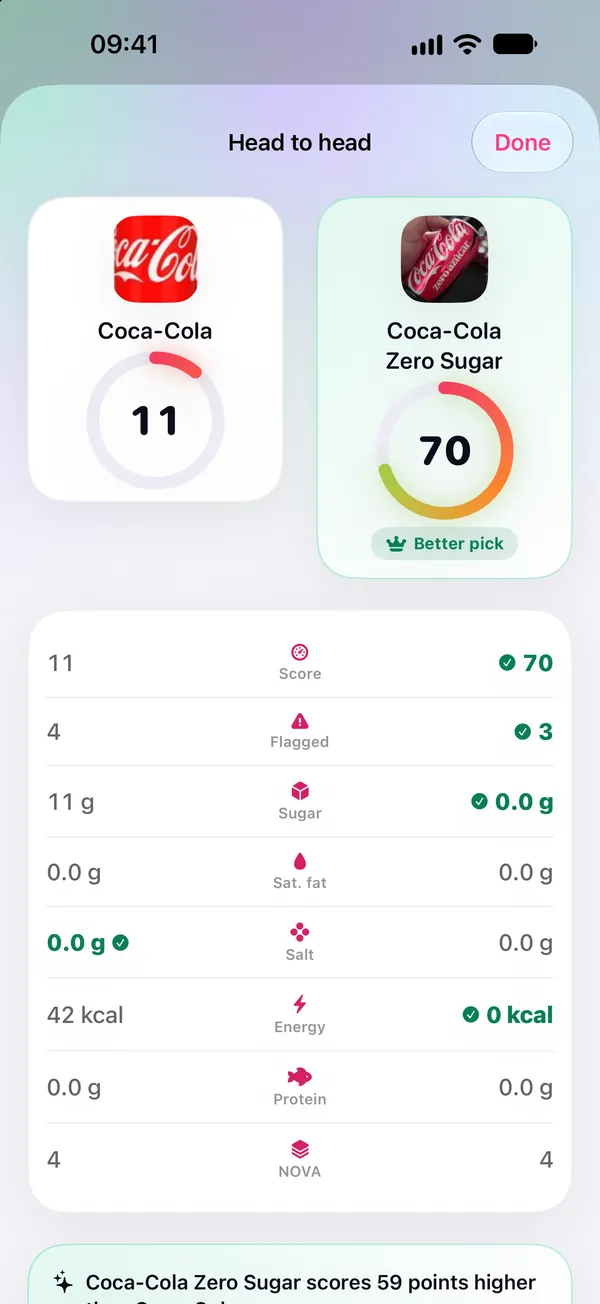
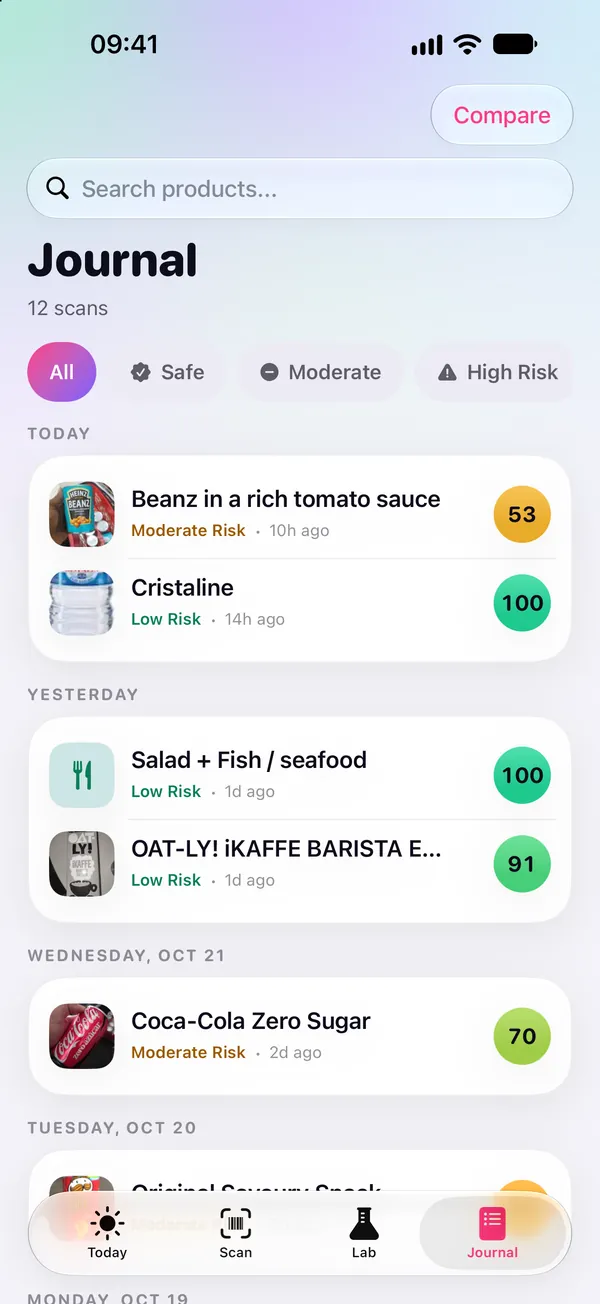
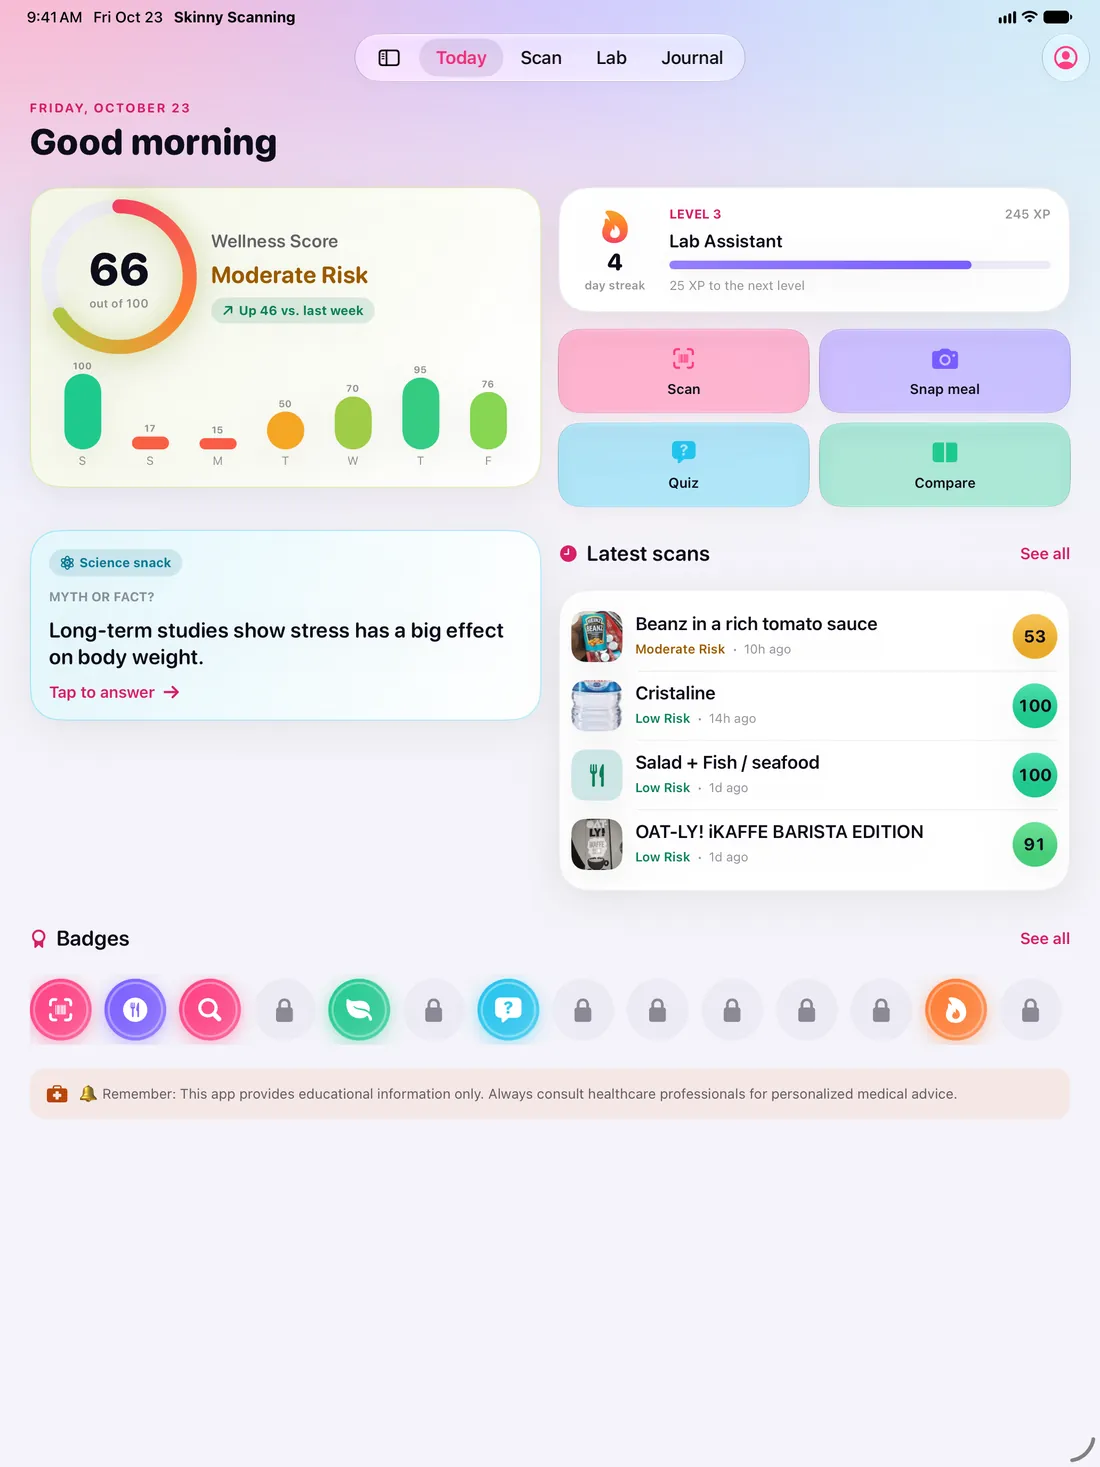
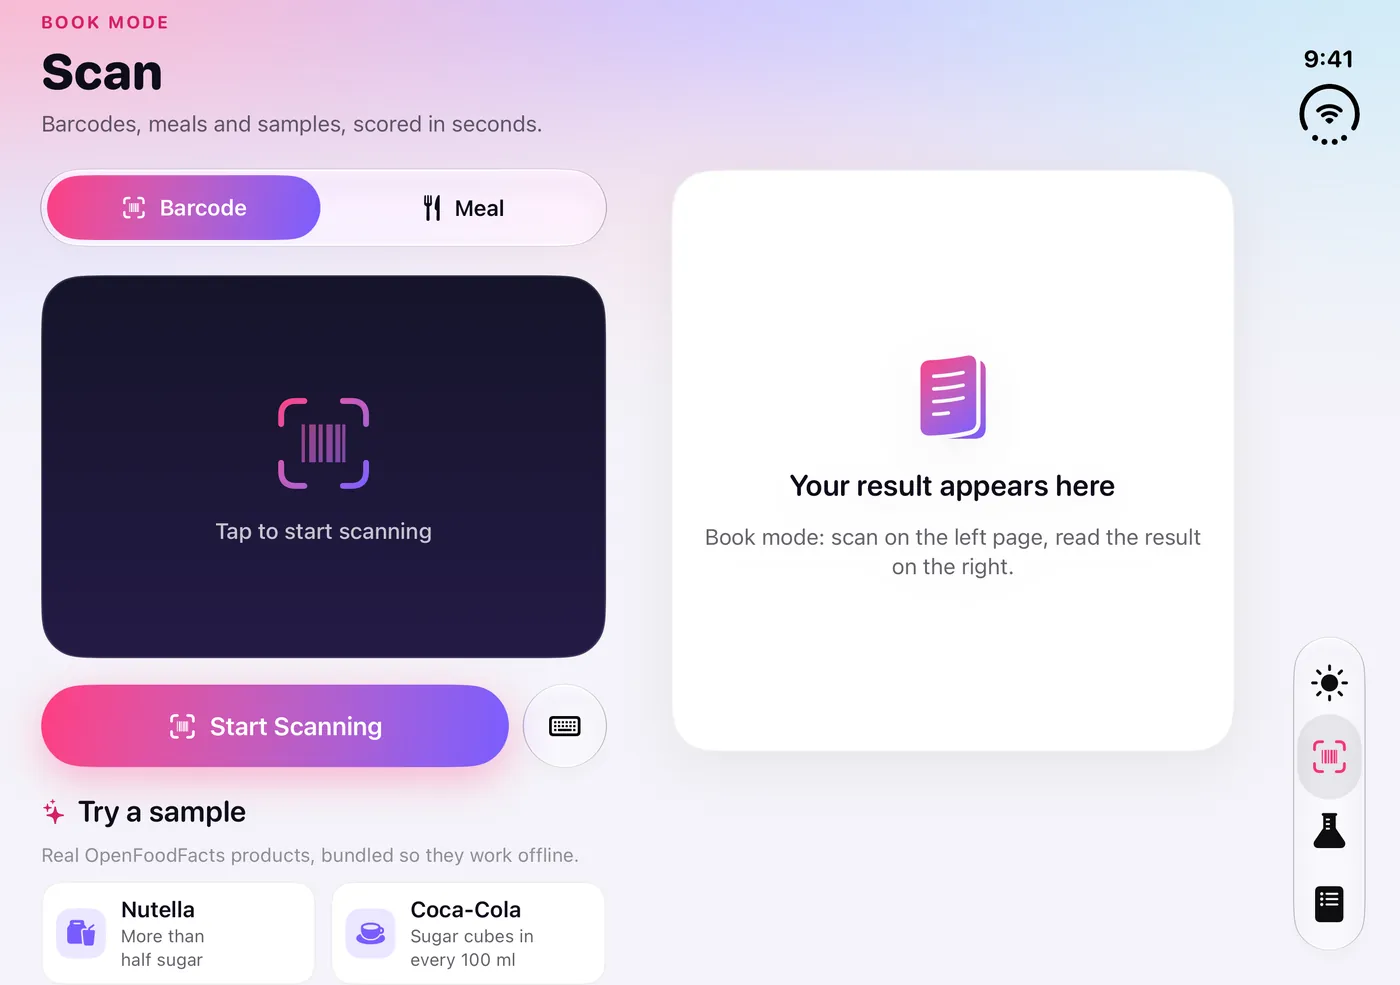
The layout follows the space it gets: one column on iPhone, two or three on iPad, and nothing drawn under a foldable's hinge.
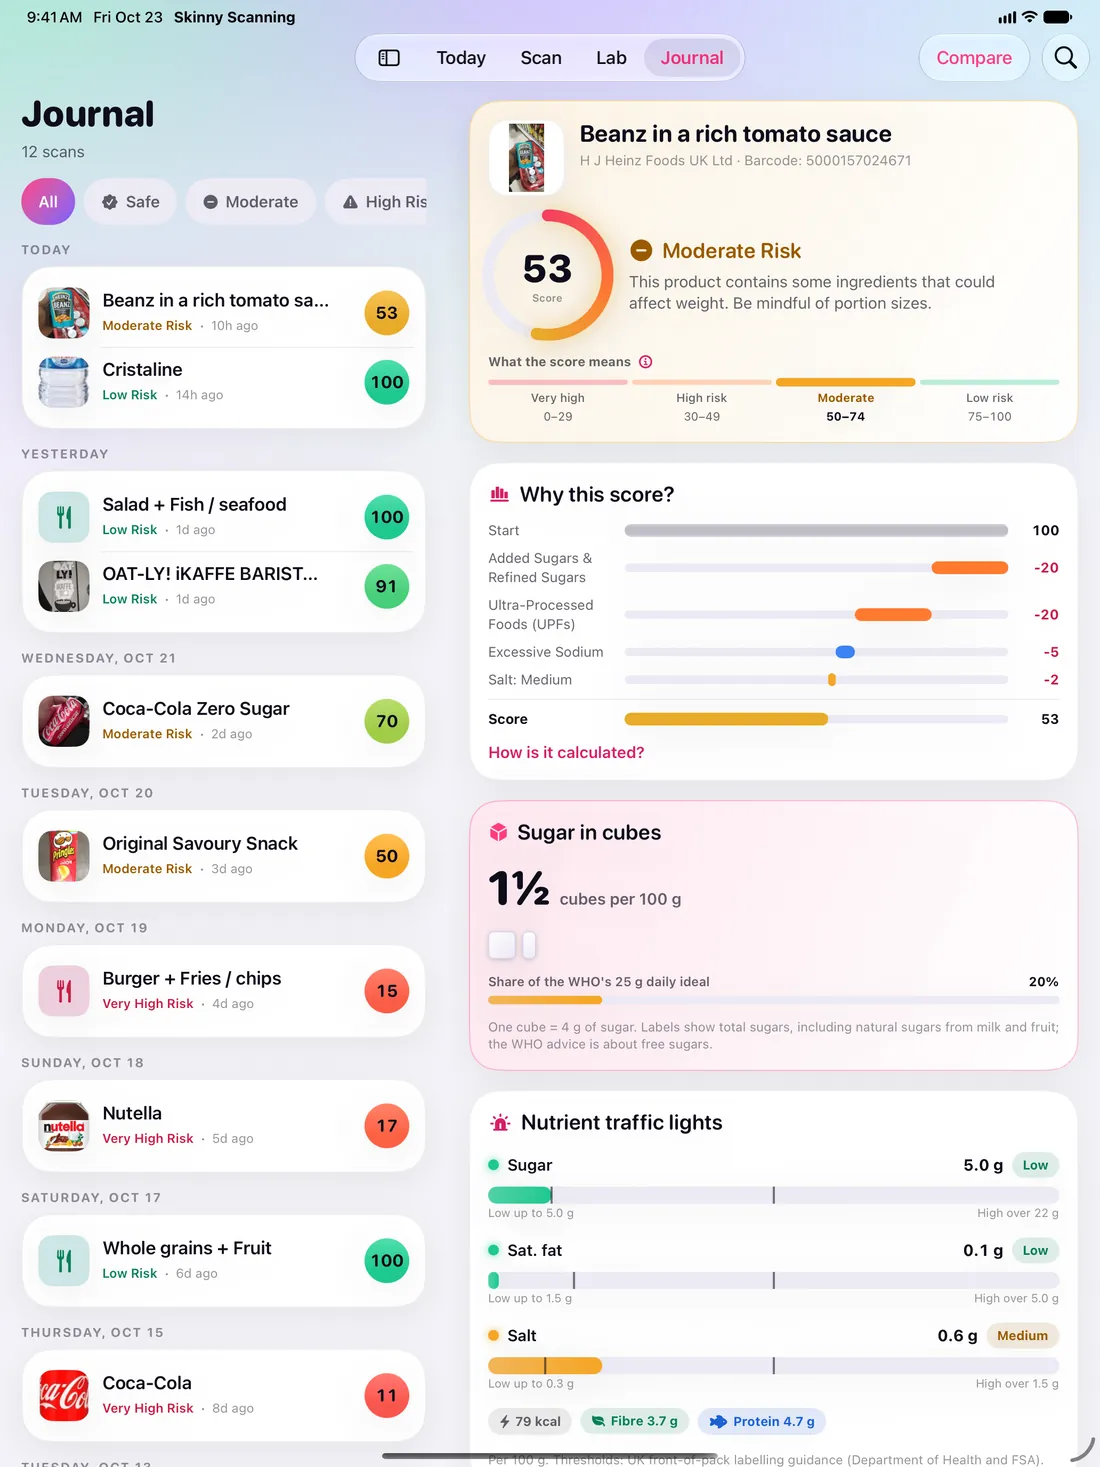
Scan, Today, Lab and Journal, with Liquid Glass controls over the camera.
Two and three columns, Split View and multiple windows.
Half-open in book mode: the scanner on one side, the result on the other.
Your score, streak, recent scans, a quick quiz and a sugar converter, plus complications for your watch face.
An Android version for phones, tablets, foldables and Wear OS is in preparation.
Every reference was checked against its DOI, PubMed record and abstract. Animal studies say which animal, observational links are not called causes, and trials that found no effect say so.
In a 4-week inpatient crossover trial, 20 adults ate about 500 kcal a day more on an ultra-processed diet and gained about 0.9 kg in two weeks.
In adult trials, adding sugary drinks raised weight by about 0.85 kg; in cohorts, each extra daily serving was linked to more weight gain in children and adults.
Cutting free sugars lowered adult weight (about 0.8 kg) and adding them raised it; swapping sugars for other carbohydrates at equal calories did not change weight.
In 120,877 US adults, each extra daily serving of processed meat was linked to about 0.4 kg more weight gain every four years.
In 41,518 women, increases in animal, saturated and trans fat intake were linked to weight gain over eight years; total fat only weakly.
Randomised trials showed no significant effect of low-calorie sweeteners on BMI; cohort studies linked regular use to modestly higher BMI, an association rather than proof of cause.
Trials showed lower body weight with more fibre, and cohorts showed the greatest benefit at 25–29 g of fibre a day.
In mice, the emulsifiers carboxymethylcellulose and polysorbate-80 altered gut bacteria and caused low-grade inflammation and weight gain.
This site speaks 108 languages, and the app more than ninety, from the most spoken to the rarely served.
Your scan history, progress and settings are stored on your iPhone. Meal photos are recognised on the phone and never uploaded. Only a barcode number is sent, to OpenFoodFacts, to look the product up. Your Apple Watch gets its summary straight from your iPhone.
Another question? Write to us: support@skinnyscanning.com
Try it free for 3 days, then start with the sample products in the Scan tab: no camera needed to see your first result.
They told you losing weight was all about willpower.
They were wrong.
You can't change what you don't understand.
Stop guessing what you eat. Start seeing it.
Eat with knowledge. Live with freedom.
Skinny Scanning — Scan your food. Understand your choices. Take control.